The AlertOps Experience Update is rolling out to every AlertOps customer. It reorganizes the web app around the way an incident runs, starting with a left-side menu that keeps every part of AlertOps one click from any screen. This post walks through what you will see when you log in, where everything lives now, and a few things worth trying first.
Your data, schedules, escalation policies and integrations carry over exactly as they are, so there is nothing to migrate or reconfigure.
Key takeaways
- A left-side menu lists 12 sections in incident order, from Dashboard and Alerts through to Response Orchestration and Administration, and stays in place on every screen.
- Integration setup walks through nine plain steps: Who, Which, What, How, When, More, API, Access and Inbound Log.
- The Alerts page adds Saved Views, Mine / My Groups / All filters and bulk assign, close and merge.
- Every incident opens to one summary with its escalation policy, SLA date, who was notified on which channel, and tabs for automation, notes and the postmortem.
- A Help Center on every page recommends articles for the screen you are on.
- Ada, the AI agent in AlertOps, is an interview-style setup copilot that walks you through setting up integrations and workflows and answers questions along the way. AlertOps Enterprise includes OpsIQ, the intelligence layer for modern incident response.
What’s new at a glance
| Update | What it does for you | Where to find it |
|---|---|---|
| Left-side menu | Puts every part of AlertOps one click away, in the order an incident runs | Every screen |
| Integration setup steps | Walks through each decision for a new integration in order | Services + Integrations |
| Saved Views and bulk actions | Keeps your go-to alert filters one click away and handles alert floods in one step | Alerts |
| Incident summary | Shows the whole response on one screen | Incidents |
| Help Center | Recommends help articles for the page you are on | Every screen |
| Ada | Interviews you step by step to set up integrations and workflows, and answers questions as you go | Built into the platform |
A left-side menu that follows the incident
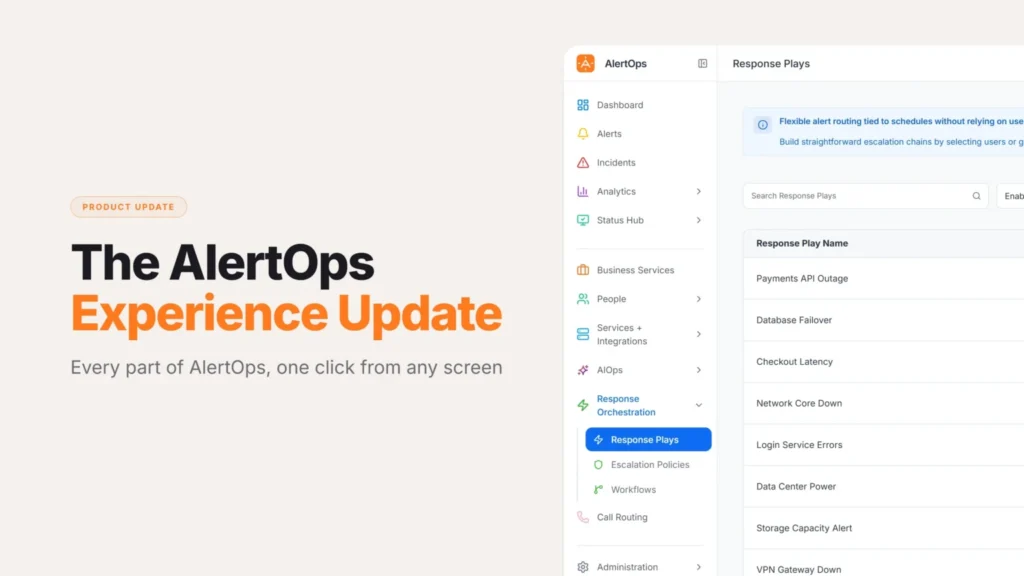
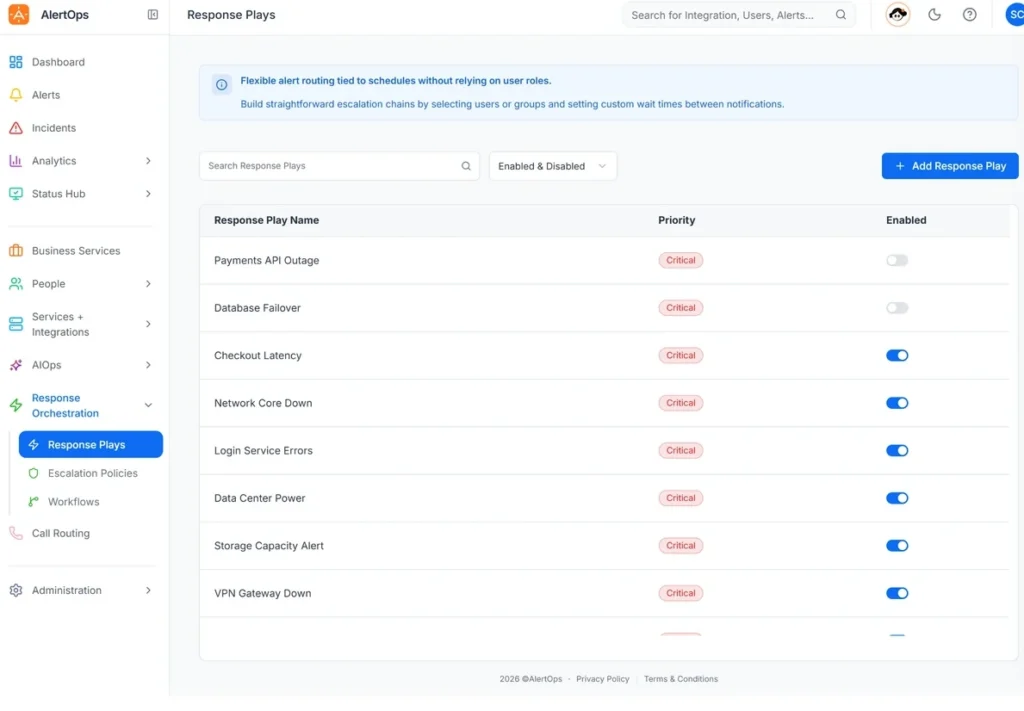
The left-side menu is the biggest change in the Experience Update. It lists 12 sections in the order work happens during an incident: watch the dashboard, work the alerts, run the incident, review the numbers and keep stakeholders informed, then manage the people, services and rules behind it all. The menu stays put as you move, so you can jump from an alert to the on-call schedule to the escalation policy without losing your place.
Each section expands in place to show its pages, and settings that teams reach for together sit together.
| Menu section | What it holds |
|---|---|
| Dashboard | Alert counts, mean time to acknowledge and resolve, group summary and group SLA |
| Alerts | The live alert list with saved views, filters and bulk actions |
| Incidents | Every incident with its summary, automation, notes, postmortem and audit trail |
| Analytics | Alerts & Incidents and Services reports |
| Status Hub | Hub, Service Catalog, Status Pages, Templates and Usage |
| Business Services | The business services your stakeholders follow |
| People | Users, and Groups & Schedules |
| Services + Integrations | Technical Services, Inbound Integrations, Heartbeat Integrations, Inbound Log, Outbound Integrations and Maintenance Windows |
| AIOps | OpsIQ correlation settings |
| Response Orchestration | Response Plays, Escalation Policies and Workflows |
| Call Routing | Live Call Routing for inbound phone calls |
| Administration | Custom Alert Fields, Postmortem Fields, Roles, Topics, Bridges, User Attributes, Audit Trail and Holidays |
Three groupings save the most clicks. Response Orchestration puts Escalation Policies, Response Plays and Workflows side by side, so you can compare and adjust how alerts are routed in one place. Services + Integrations follows an alert from where it enters (inbound integrations, heartbeats and the inbound log) to where it goes next (outbound integrations), with maintenance windows alongside. People keeps users next to the groups and schedules they belong to, which is where an on-call lead spends most of their setup time.
Integration setup, step by step
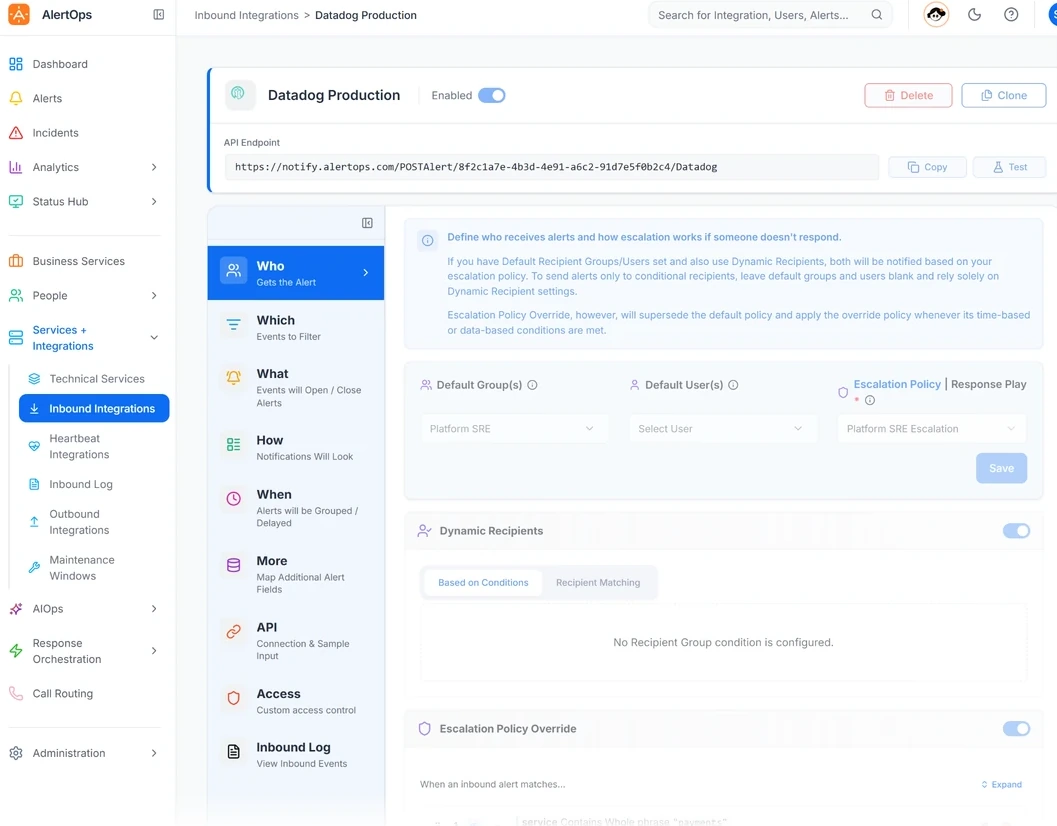
Every inbound integration now opens to a setup rail on the left. Each step names the decision it covers, so whoever connects a new monitoring tool can work through it top to bottom and know exactly what they are configuring.
| Step | What you set |
|---|---|
| Who | Who gets the alert: default groups, default users and the Escalation Policy or Response Play |
| Which | Events to filter |
| What | Events that open or close alerts |
| How | How notifications will look |
| When | When alerts are grouped or delayed |
| More | Additional alert fields to map |
| API | The connection and a sample input |
| Access | Custom access control |
| Inbound Log | The inbound events this integration has received |
Connecting Datadog, for example, means setting who gets paged, which events matter and when related alerts should group, then opening the Inbound Log to confirm the first events arrived. The Who step also holds Dynamic Recipients and Escalation Policy Override, for teams that route by alert content or time.
Saved views and bulk actions on the Alerts page
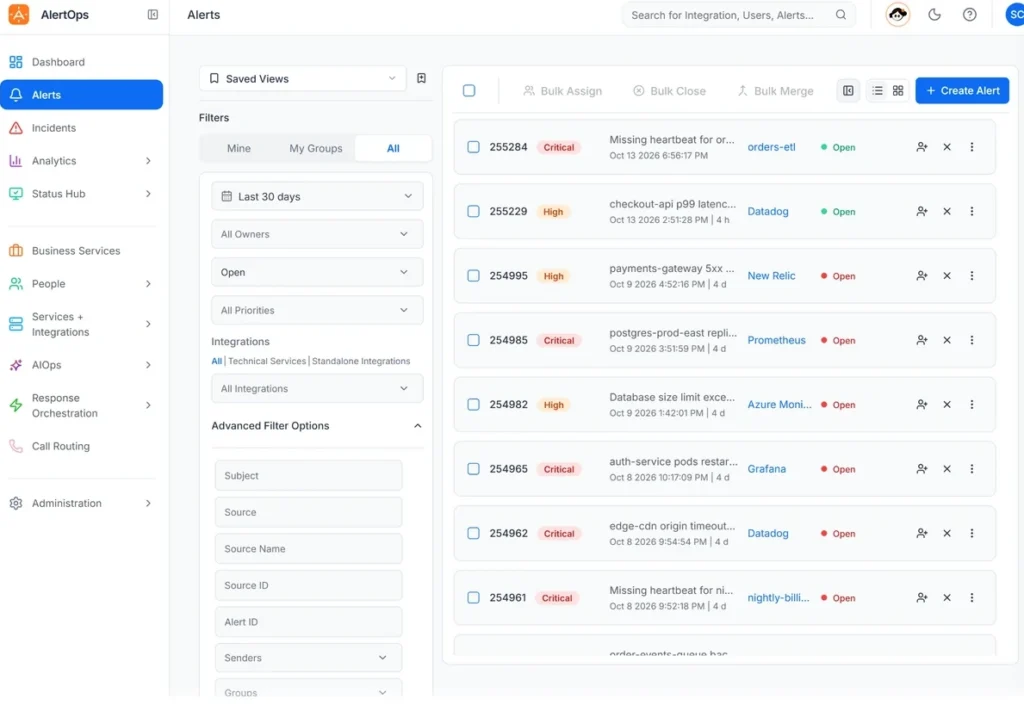
The Alerts page is where responders spend most of a shift, so it gained the most day-to-day shortcuts. Saved Views keep a filter like “Critical, my groups, last 30 days” one click away, and on AlertOps Enterprise you can share a Saved View so the whole team works from the same list. Quick filters switch between Mine, My Groups and All, and advanced filters narrow the list by integration, technical service, group, escalation policy, Response Play or topic.
When a monitoring tool floods the queue, select the related alerts and assign, close or merge them in one step. Manual alerting stays a single Create Alert button at the top of the list.
One screen for every incident
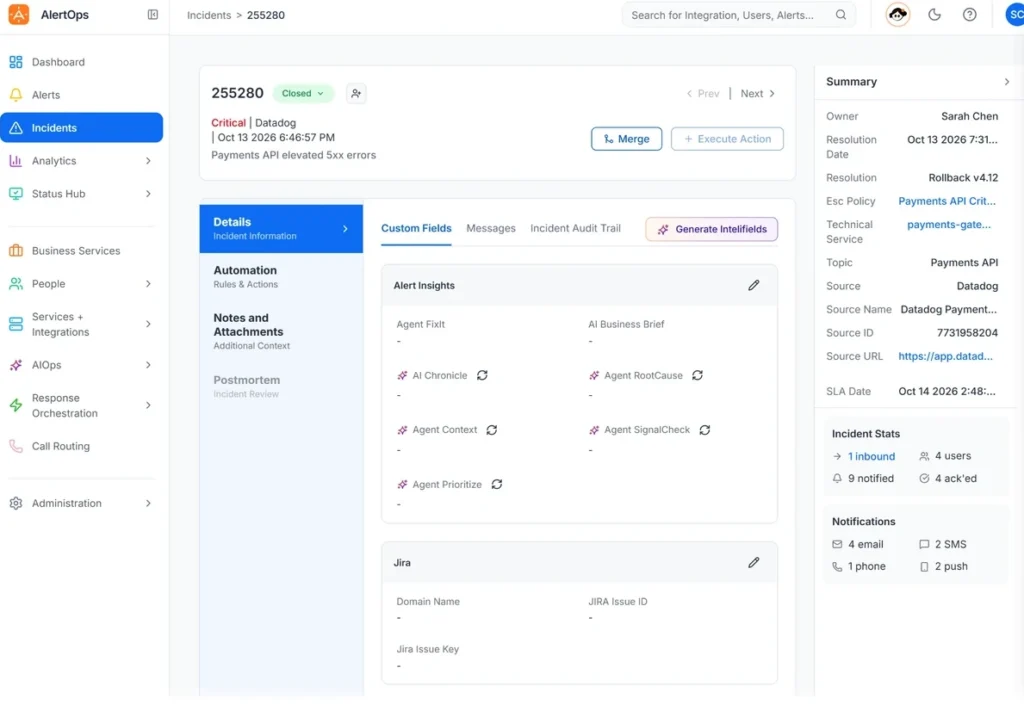
Each incident opens to a single summary: status, priority, owner, the escalation policy in use, the technical service, topic, source and SLA date. Beside it, incident stats show how many inbound alerts were grouped, how many people were notified and how many acknowledged, with a breakdown across email, SMS, phone and push.
Tabs hold the rest of the response. Automation shows the rules and actions that ran, Notes and Attachments collects context from responders, and Postmortem holds the incident review and Agent Chronicle output. The incident audit trail records what happened and when. You can also generate Intellifields from the same screen, so remediation steps and likely root cause sit right next to the incident.
For more on running the response itself, see our guide to incident response coordination.
Help on every page
A Help Center panel is available on every screen, and it recommends articles for the page you are on. Open it from an alert and you get guidance on alert status and response actions, manual alerts, topics and Connect Bridge; open it from an incident and it suggests escalation policies, postmortem reports and Historical Alert Insights. Quick start, API docs and a direct line to AlertOps support are in the same panel.
New team members learn the platform in context, and admins spend less time pointing people to the right setting.

Ada and OpsIQ where you work
Ada, the AI agent in AlertOps, is an interview-style setup copilot built into the platform. Tell Ada what you want to connect or automate, and it asks the questions one at a time, then helps you set up the integration or workflow from your answers. Ada also answers questions along the way, from who is on call for a group to which alerts are still open, without leaving AlertOps.
AlertOps Enterprise includes OpsIQ, the intelligence layer for modern incident response. The Smart Correlation Engine groups related alerts in real time and cuts alert noise by roughly 68% (AlertOps platform data). Its settings live under AIOps, next to custom alert fields and maintenance windows. Agent Chronicle automates postmortem creation, capturing what happened, how it was resolved and what comes next.

What stays the same
The Experience Update runs on the same AlertOps platform and the same data. Schedules, escalation policies, Response Plays, workflows, integrations, users and alert history are all in place the first time you log in.
Integrations keep sending alerts as they always have. AlertOps connects to 200+ tools, including ServiceNow, Slack and Microsoft Teams, and none of them need reconfiguring. Phone, SMS, email and mobile app notifications work the same way, and escalation follows the same policies.
Five things to try first
- Open the left-side menu and expand Response Orchestration to see your Escalation Policies, Response Plays and Workflows together.
- On the Alerts page, set your usual filters and save them as a Saved View.
- Open one of your inbound integrations and step through Who to Inbound Log to check how it routes.
- Open a recent incident and look at the notification breakdown and the Postmortem tab.
- Ask Ada to walk you through setting up your next integration or workflow.
Want a guided tour with your own alerts? Book a demo and we will walk you through it.
FAQ
What is the AlertOps Experience Update?
It is a platform-wide update to the AlertOps web app. Its centerpiece is a left-side menu with 12 sections in incident order. It also organizes integration setup into nine steps, adds Saved Views and bulk actions to the Alerts page, puts every incident on one summary screen, adds a page-aware Help Center and builds in Ada.
Will my data, schedules or integrations change?
No. Schedules, escalation policies, Response Plays, workflows, integrations and alert history carry over as they are.
Does it change how responders get notified?
No. Phone, SMS, email and mobile app notifications work as before, and escalation follows the same policies.
How is the left-side menu organized?
It has 12 sections in the order work happens during an incident: Dashboard, Alerts, Incidents, Analytics, Status Hub, Business Services, People, Services + Integrations, AIOps, Response Orchestration, Call Routing and Administration. Each section expands to show its pages.
Where are escalation policies now?
In the left-side menu under Response Orchestration, alongside Response Plays and Workflows.
Where are on-call schedules?
Under People, in Groups & Schedules.
How do I set up an integration?
Open it under Services + Integrations. The setup rail walks through Who gets the alert, Which events to filter, What opens or closes alerts, How notifications look, When alerts group or delay, More fields to map, the API connection, Access and the Inbound Log.
Can I share a Saved View with my team?
Yes, on AlertOps Enterprise. Shared Saved Views let a whole team work from the same filtered alert list.
Is Ada part of the Experience Update?
Yes. Ada is an interview-style setup copilot built into the platform. It asks you questions step by step to set up integrations and workflows, and it answers questions about alerts, users, groups and on-call schedules.
Who gets the Experience Update?
It is rolling out to all AlertOps customers, and new teams start on it from day one.